4XCiv Explore
The whole solar system in your browser, from the orbit of Pluto down to the surfaces of planets, moons and asteroids. No game, no passphrase. Just the real place, rendered from the data humanity has gathered.
01 · Put it to work
Plan, scout, check
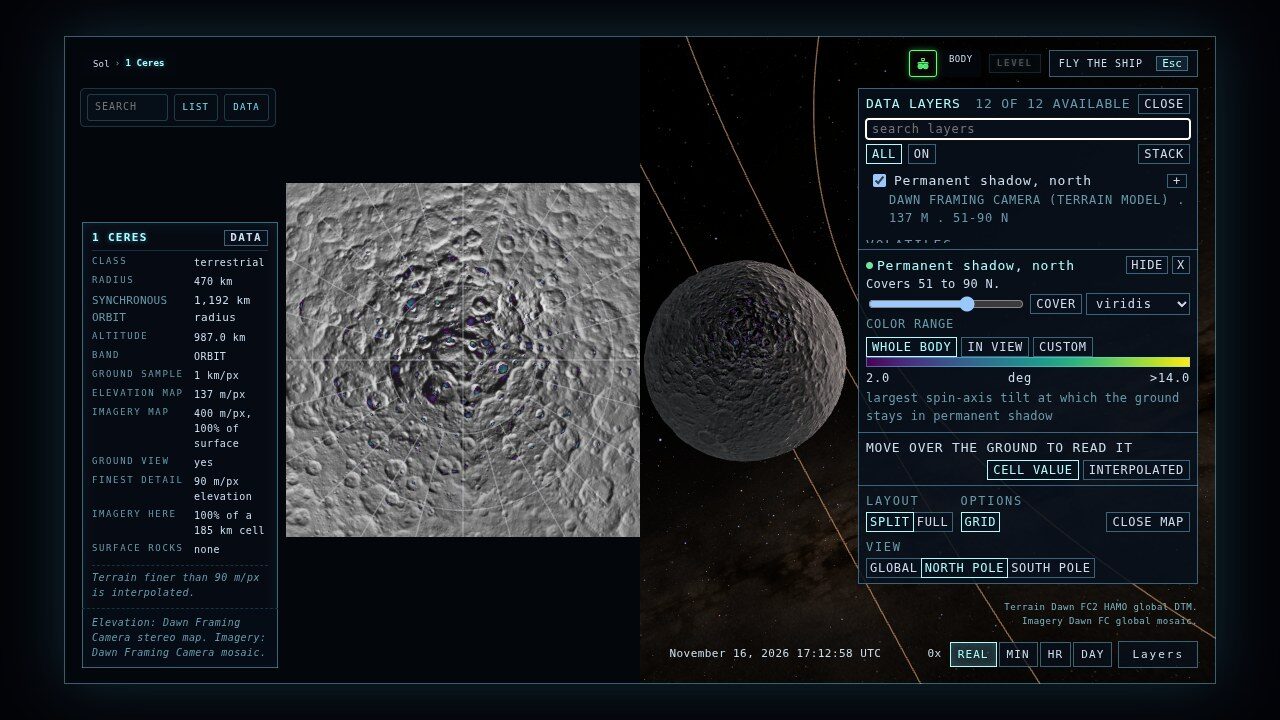
Explore is for looking, and it is also a working tool: the archives mission planners and planetary scientists use, together on one globe and one real clock.
02 · Atlas
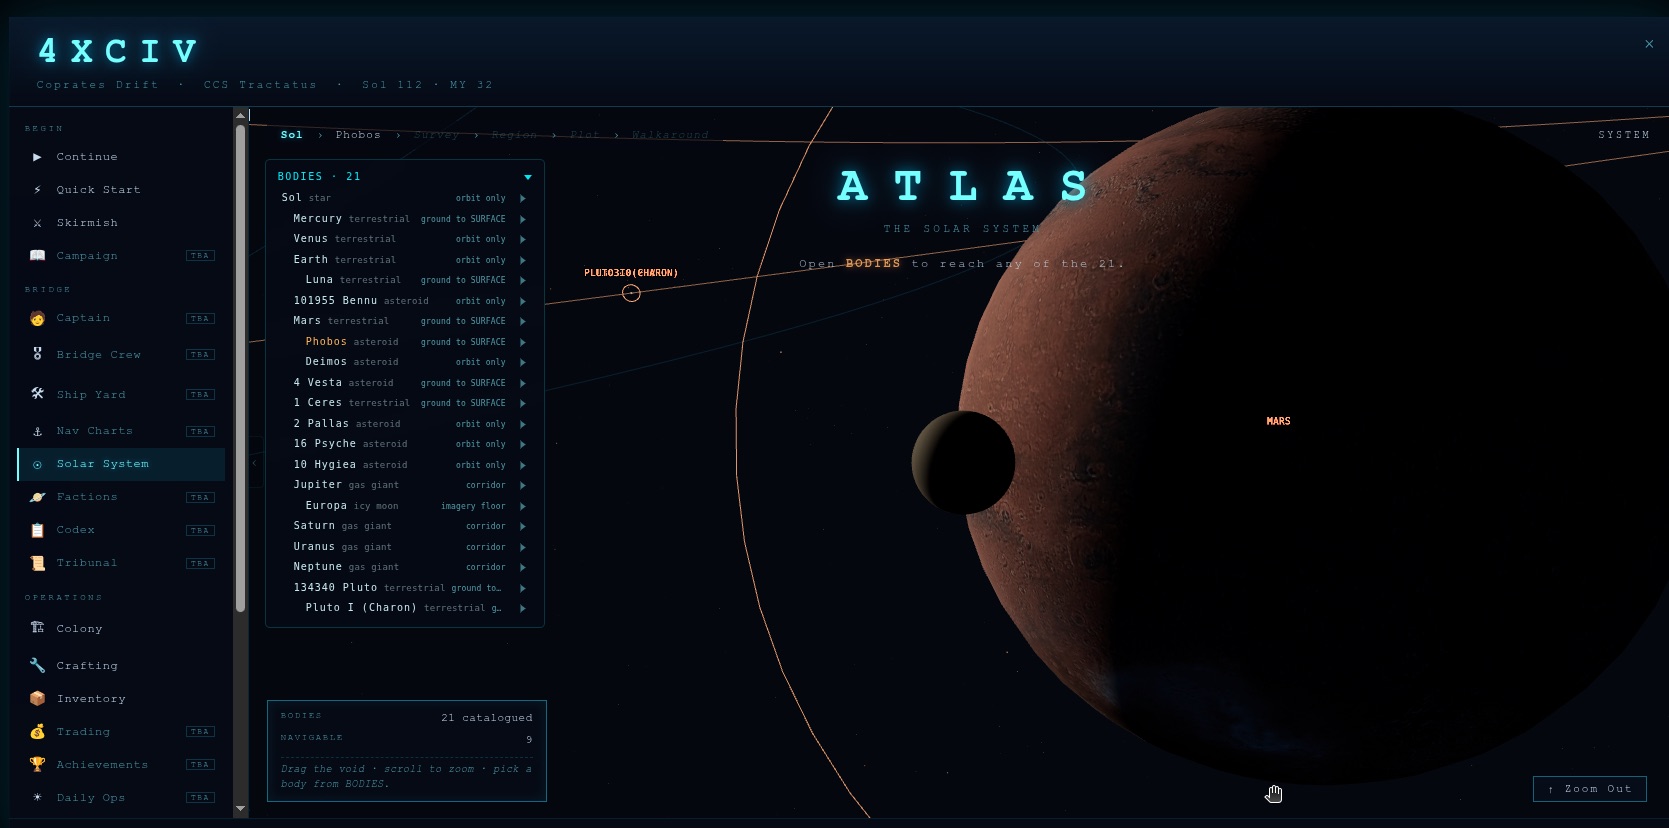
Real orbits, at real scale
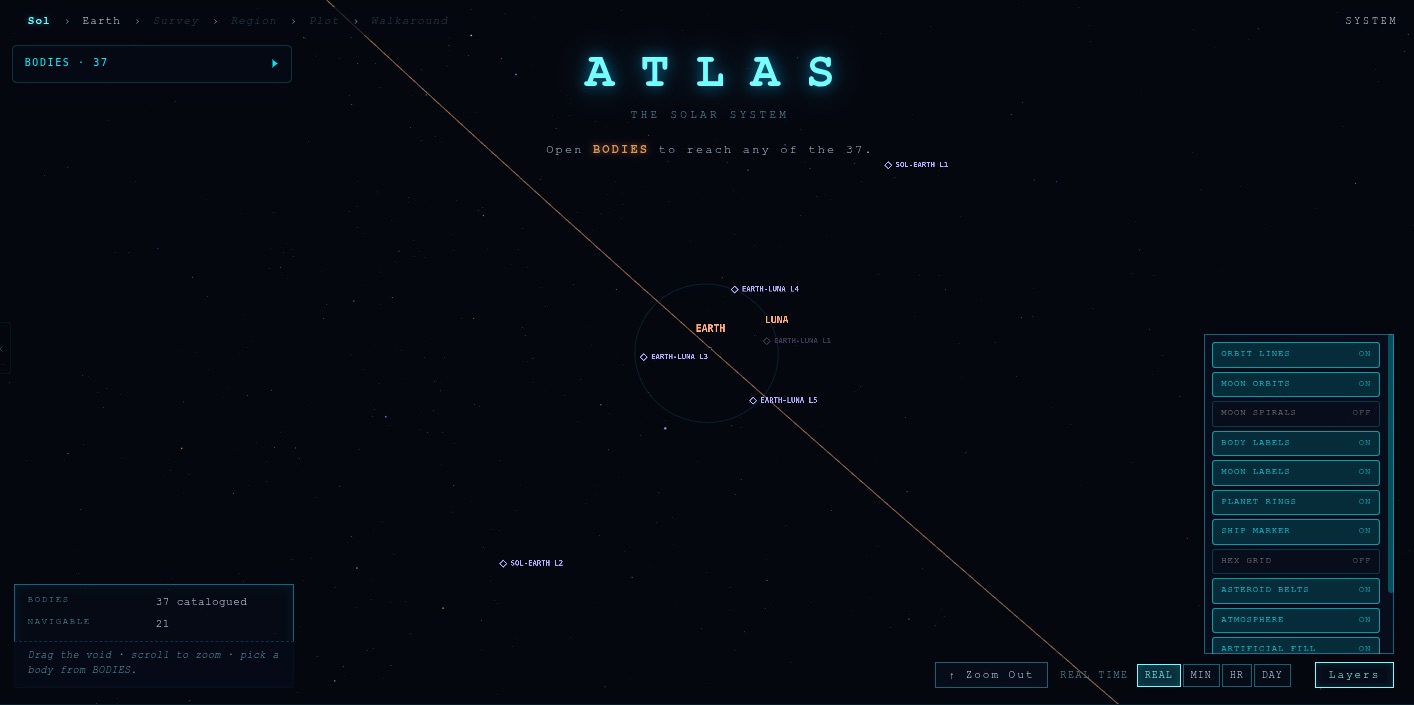
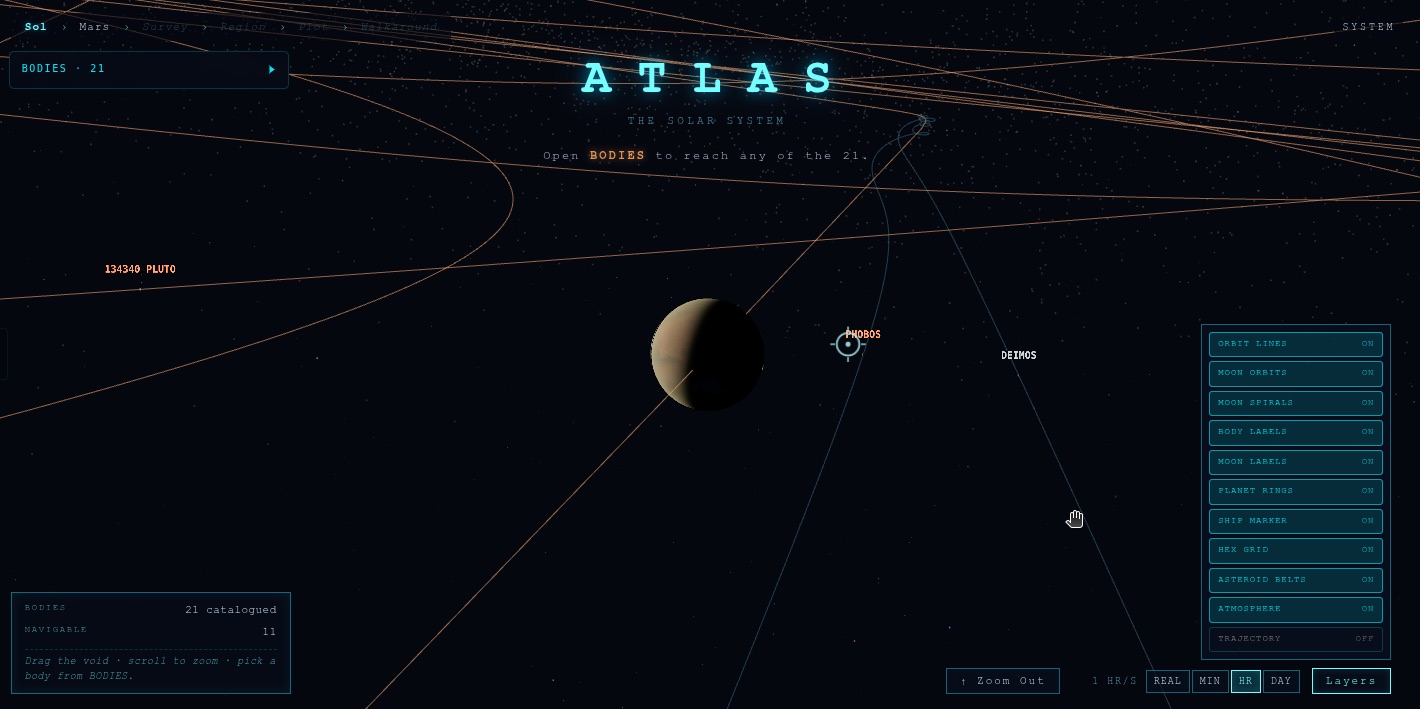
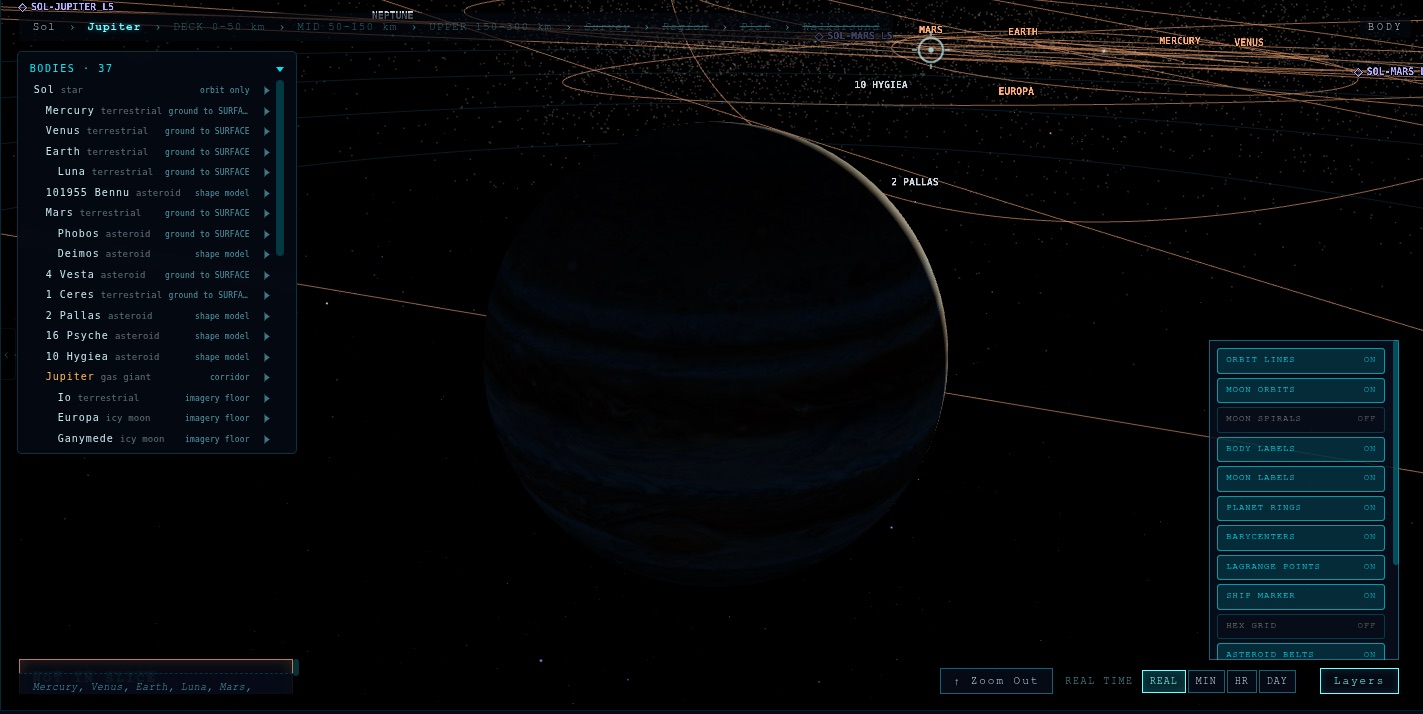
The Atlas is the map everything hangs off. Planets on JPL approximate positions, moons on JPL Horizons fits, and the points between them that physics cares about.
- Lagrange points for Sol-Earth, Sol-Mars, Sol-Jupiter and Earth-Luna.
- Barycenters, including Sol-Jupiter: Jupiter is massive enough to orbit a point outside the Sun.
- Real satellites, sorted the way operators sort them: GPS, GLONASS, BeiDou and Galileo apart, crewed counting only what people could board.
- 1.58 million small bodies from JPL's small-body database, rebuilt weekly. Near-Earth asteroids ride orbit files that include the planets' pull from 1960 to 2126, and Apophis's 2029 pass lands within about 25,000 km of JPL's own figure.
- A delta-v map pricing trips between orbits and Lagrange points: EML2 to the Moon is 0.695 km/s in 3.1 days.
- Timelapse at up to one day per second, with belts and moon-orbit spirals you can toggle.
03 · Bodies
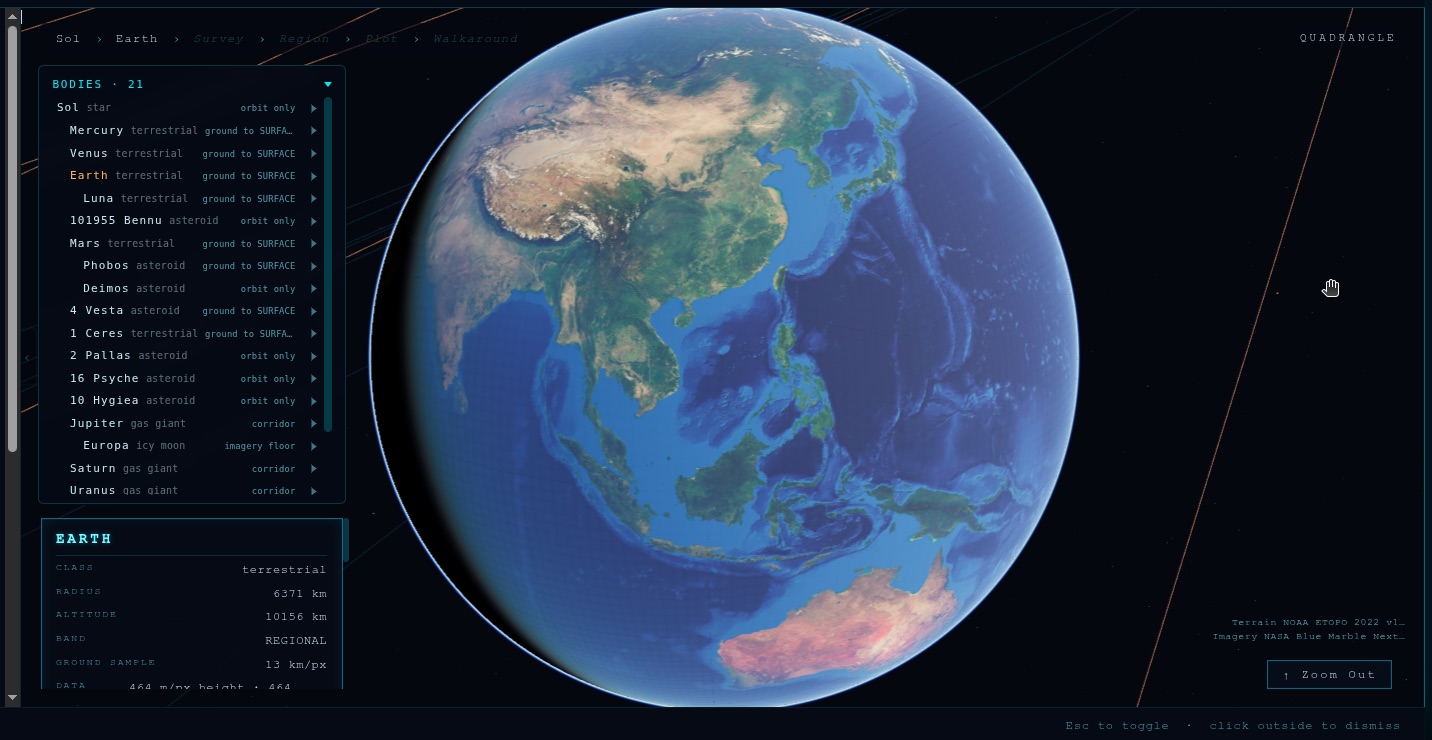
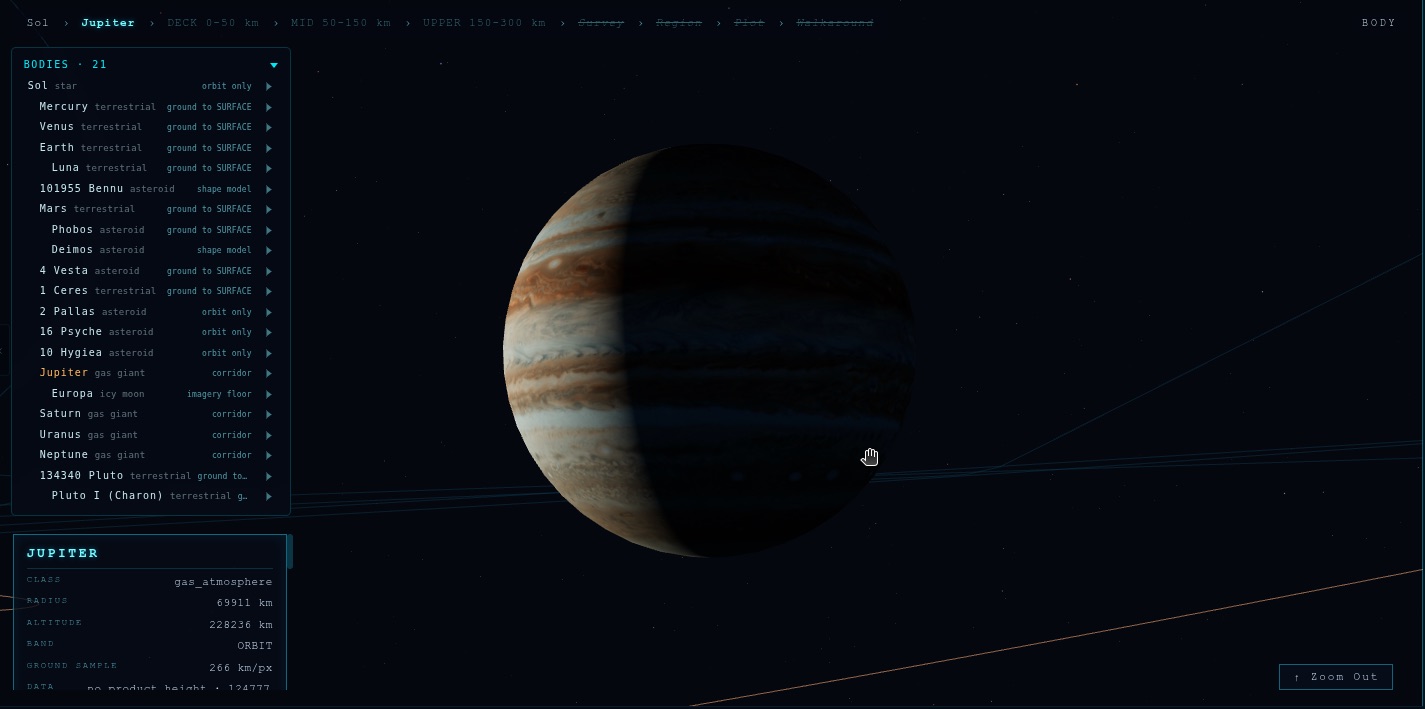
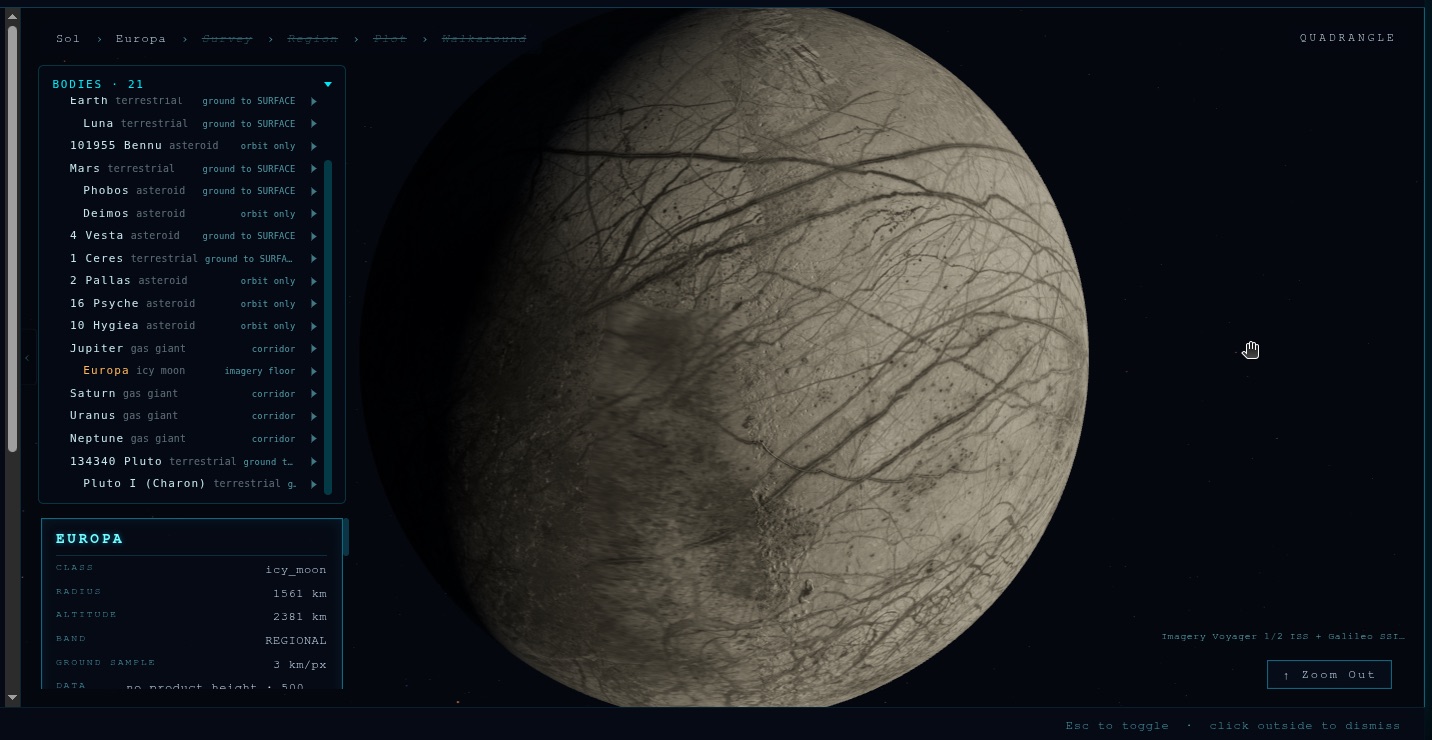
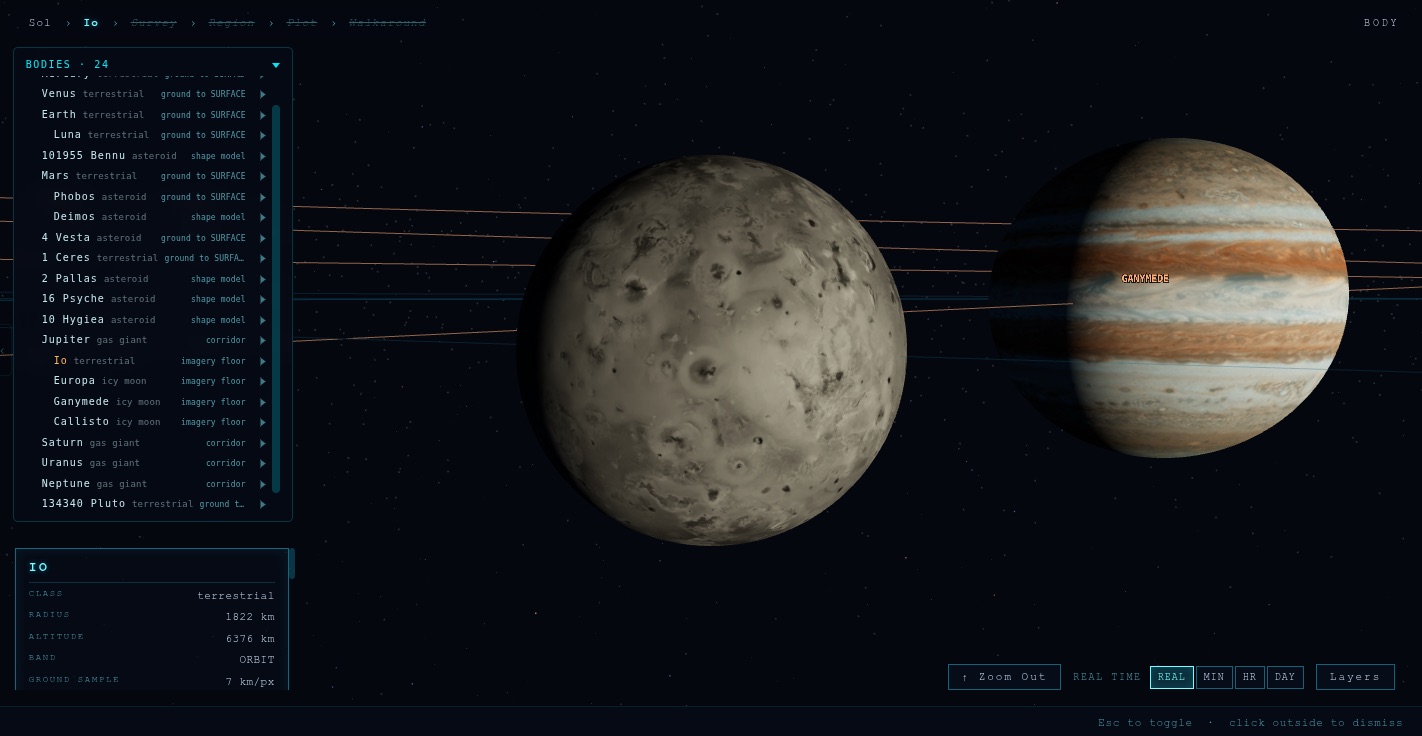
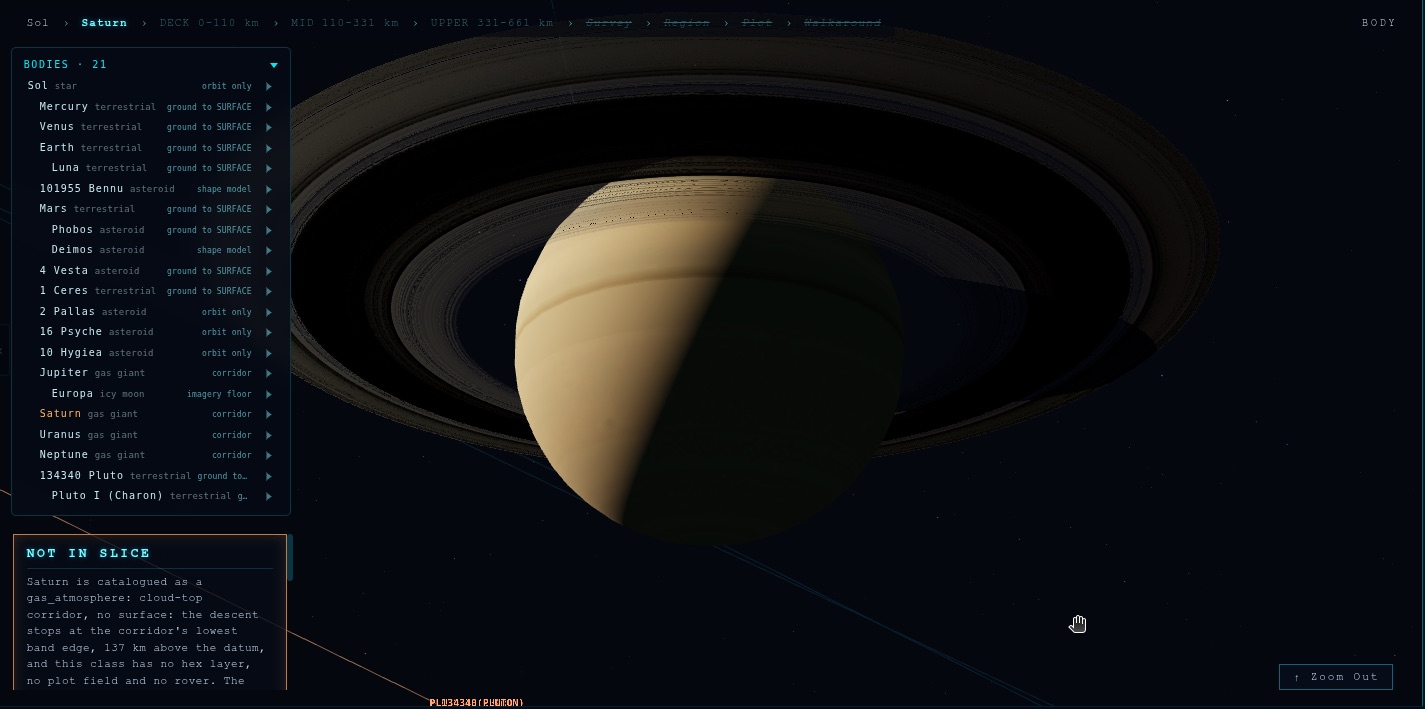
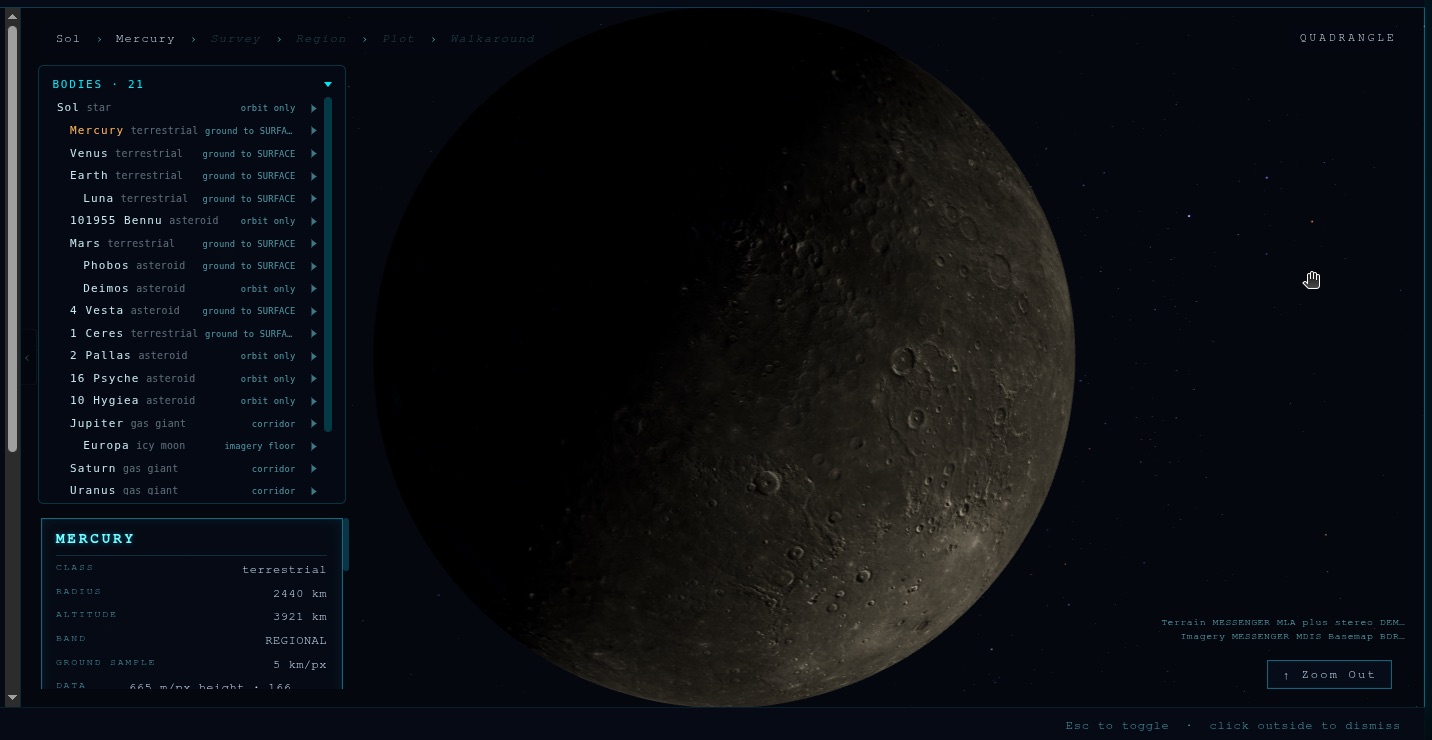
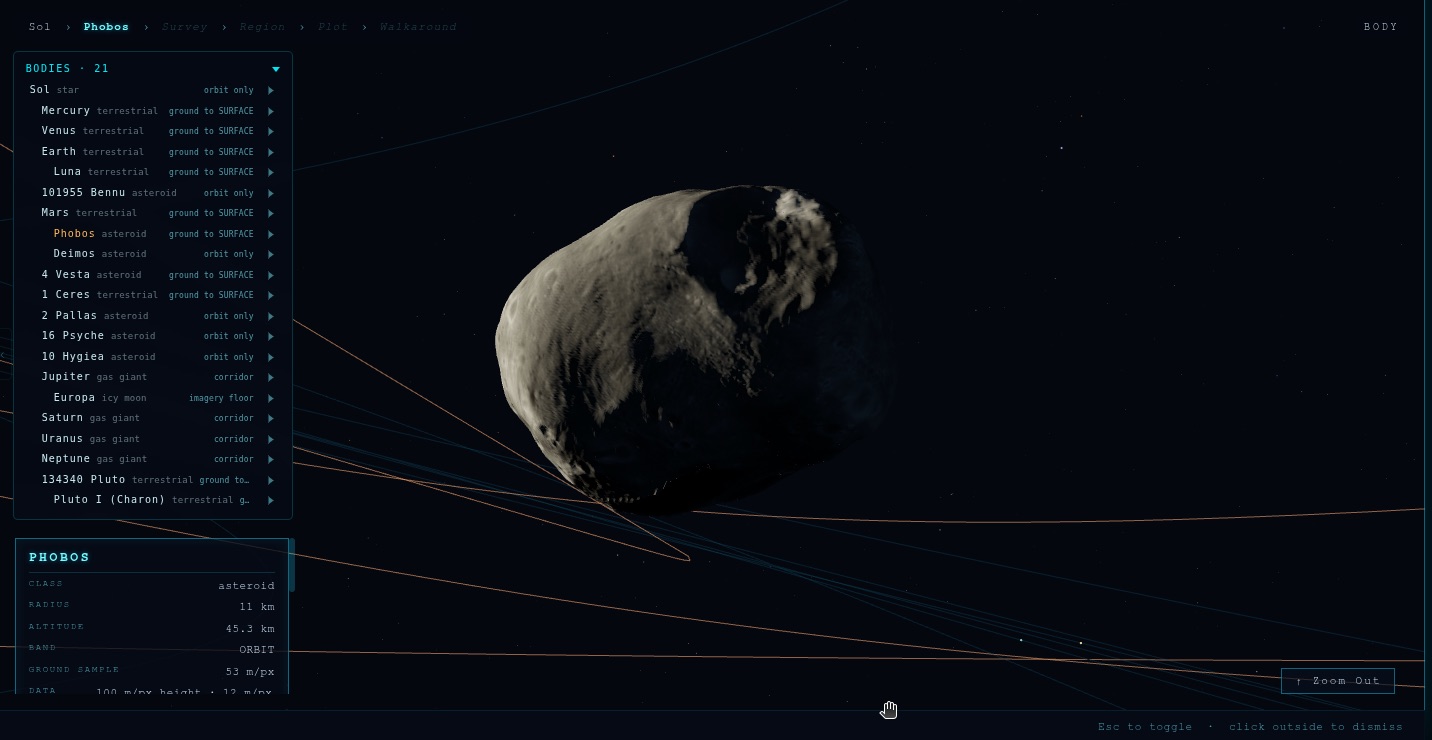
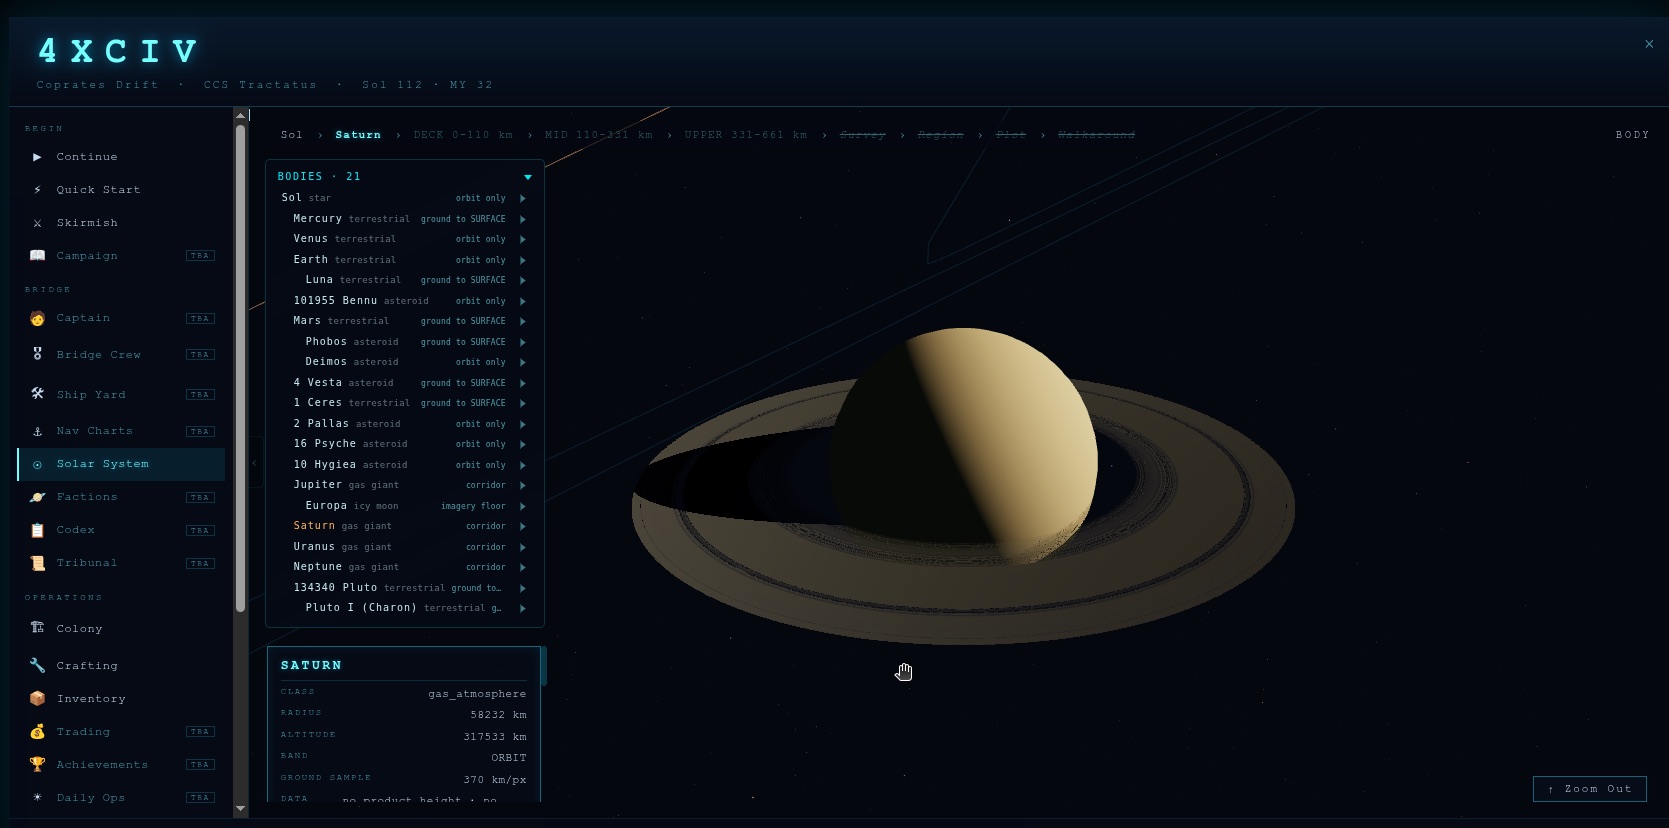
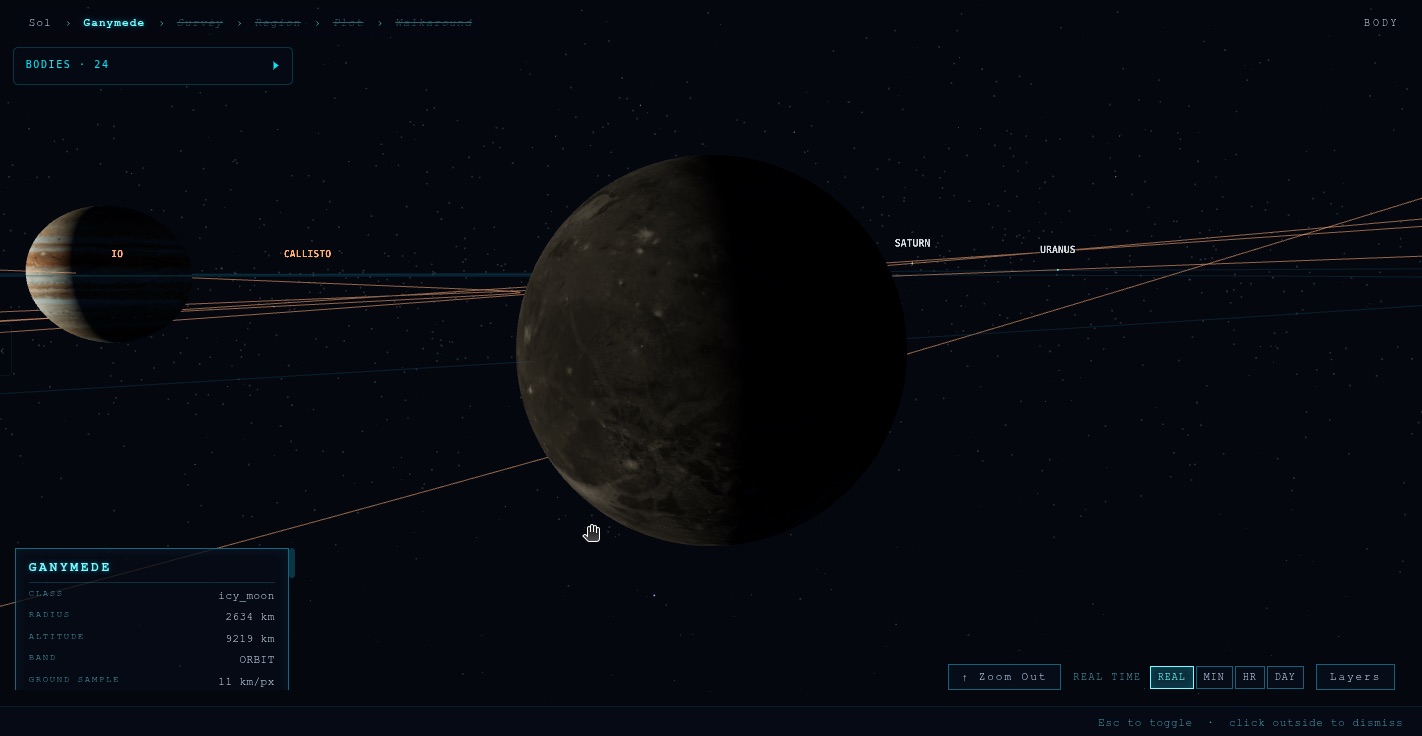
Every body from real imagery
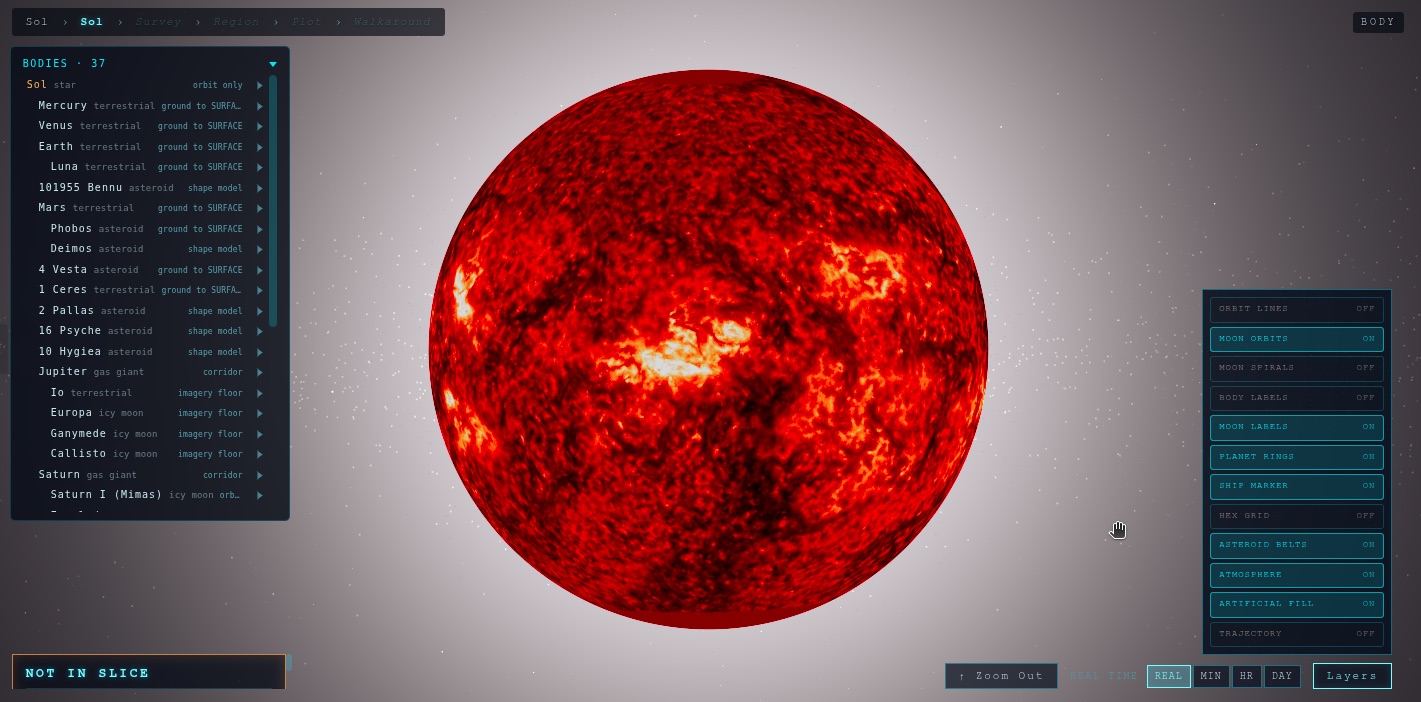
39 tracked bodies. The imagery comes from the missions that took it.
04 · Data layers
See what the missions measured
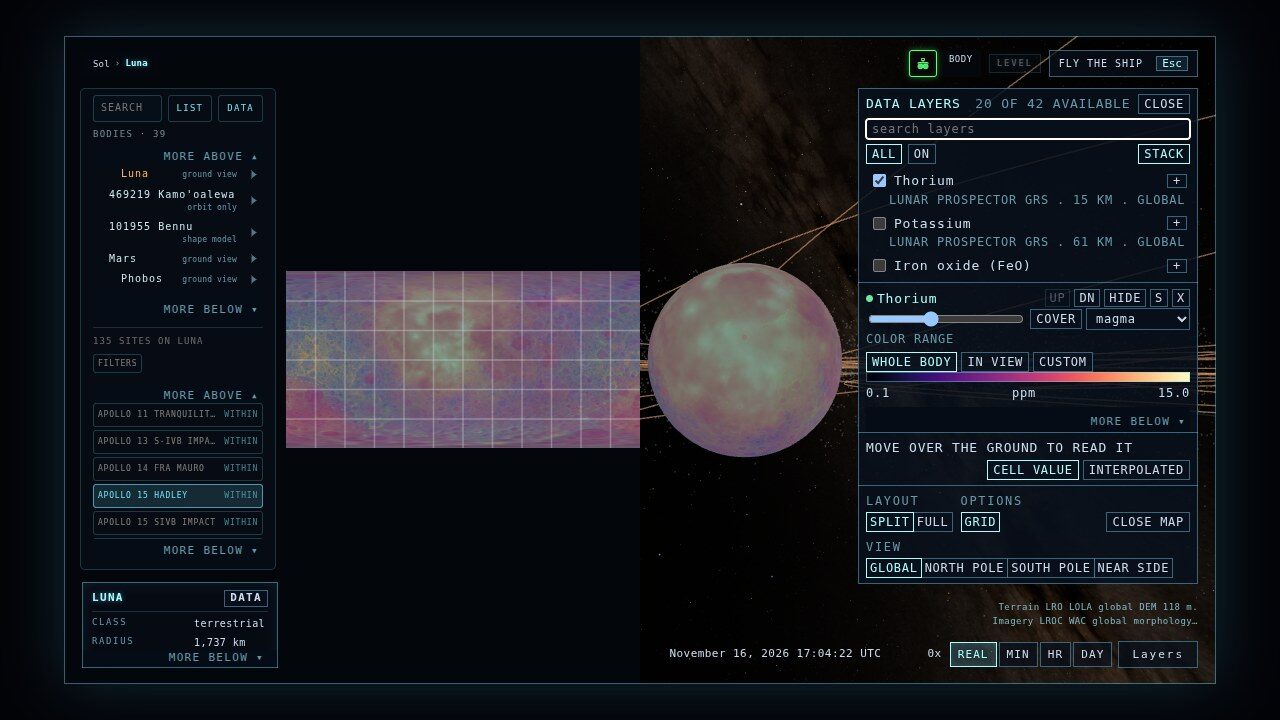
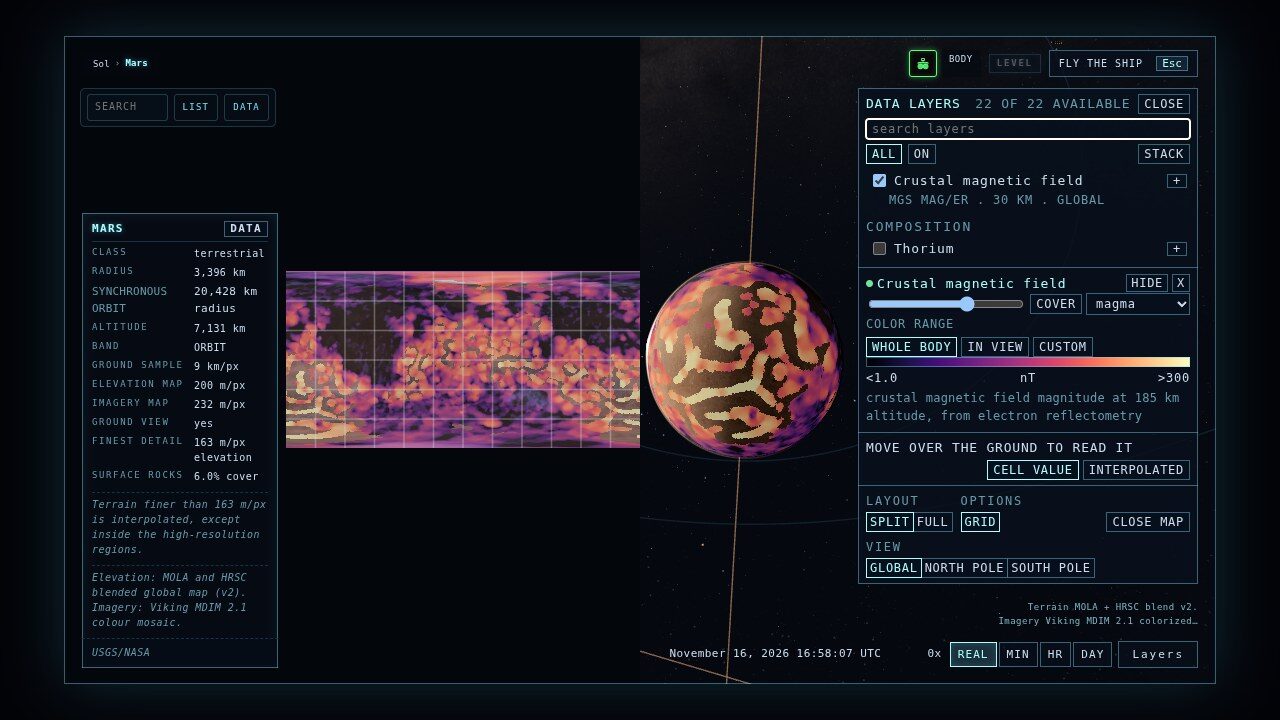
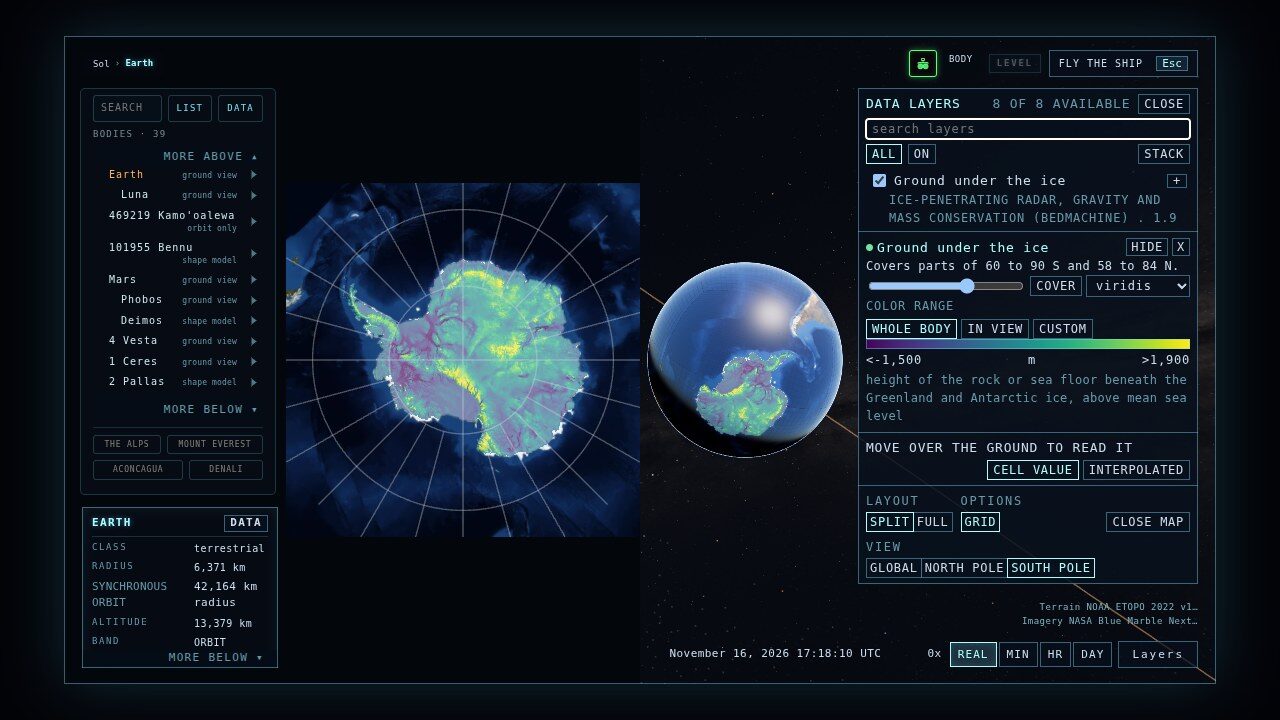
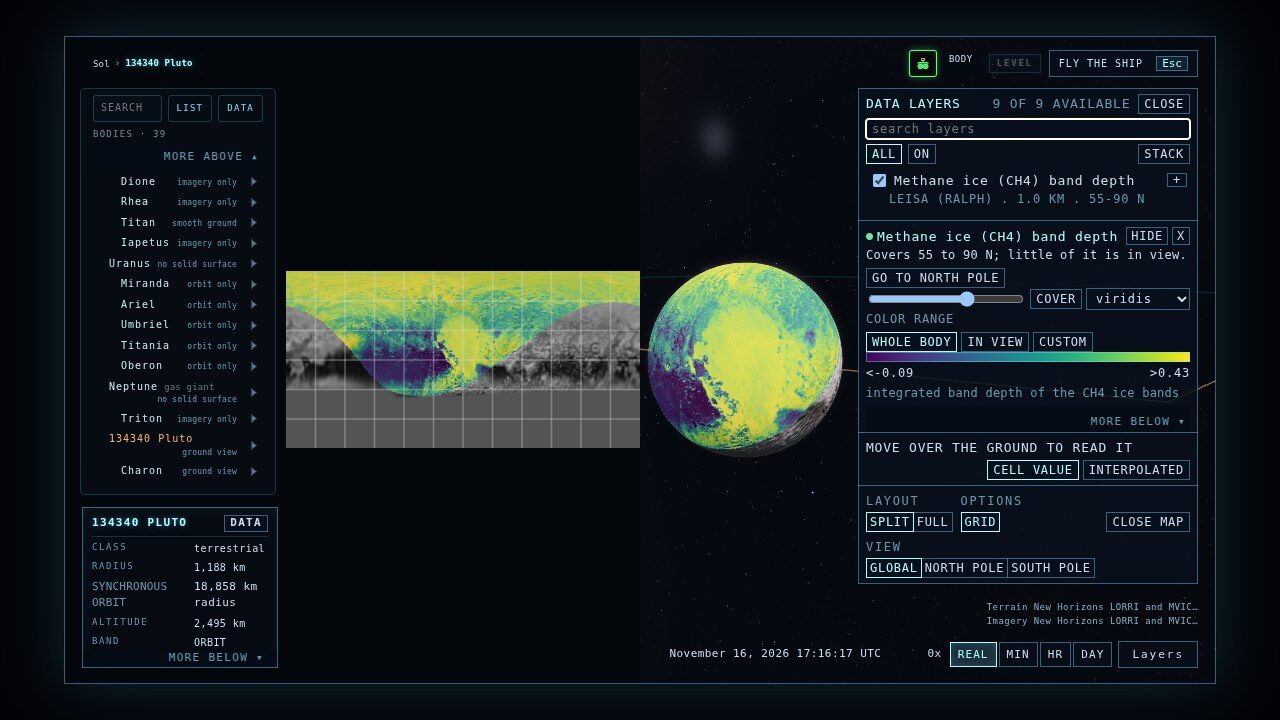
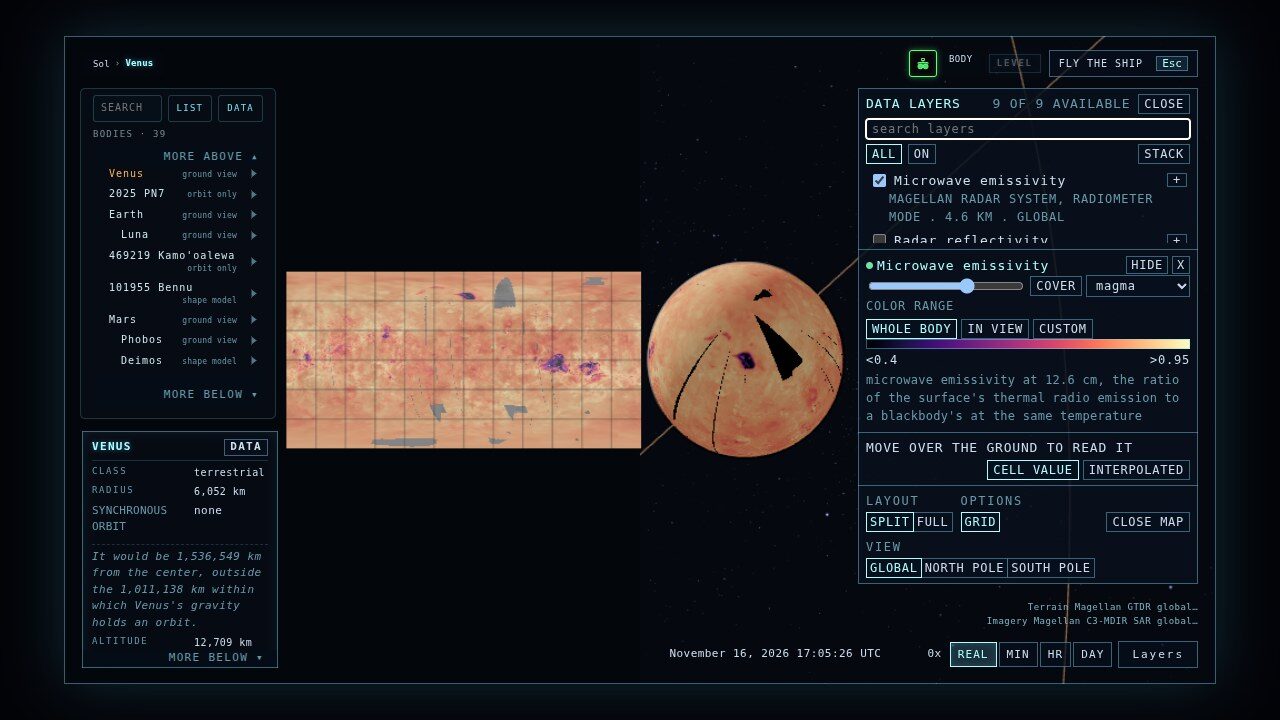
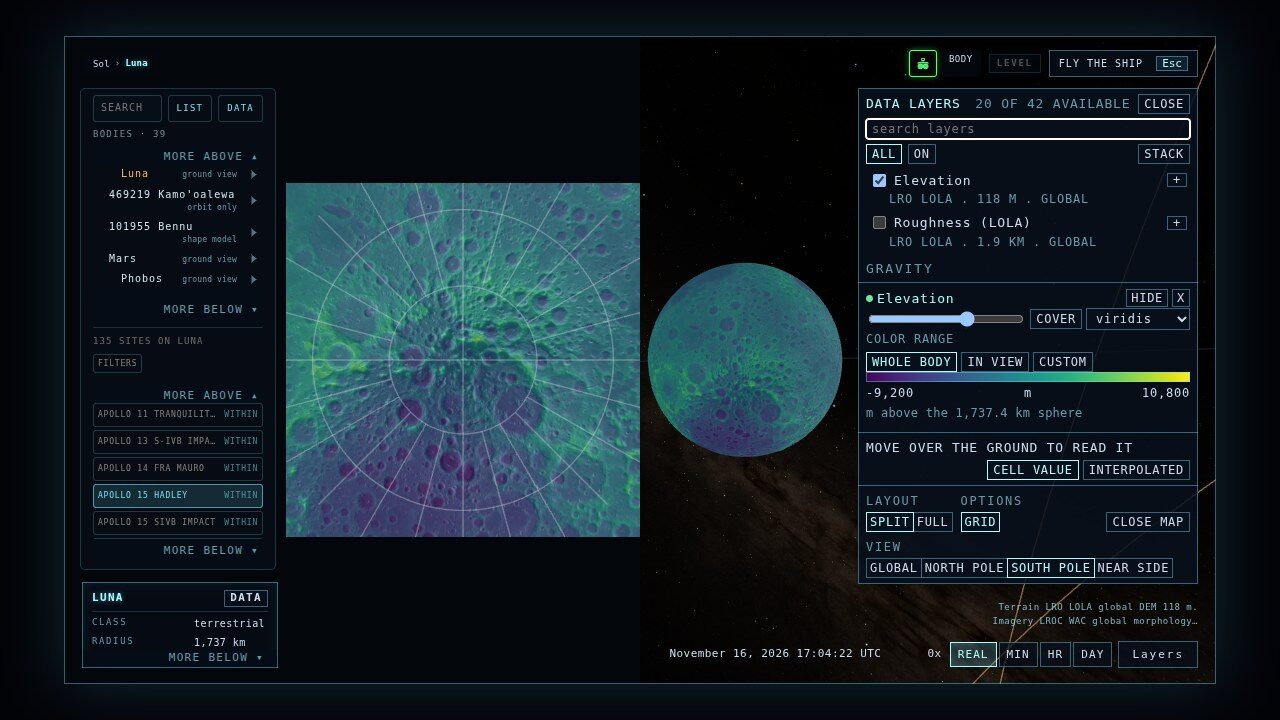
Turn on gravity, magnetism, chemistry, ice or temperature and it is drawn over the globe and on a flat map beside it, with a legend, the value under your pointer, and a card that cites the dataset. Every layer comes from a mission archive, mostly NASA's Planetary Data System.
How every layer is checked
- Known answers. Every layer is read back against its source at named points. On Mars, 11 layers matched an independent reading at all 3,000 points each.
- Controls that must fail. Each check also runs shifted, flipped and mirrored copies, and they have to fail. They do, on every layer. A shift smaller than one tile is too small for this test to catch.
- Coordinates settled. Vesta's archive maps sit 150 degrees from its height model. Read naively, Marcia crater turns from a 7.9 km bowl into a hill. Here it is a bowl.
- Flat maps and poles. Open the map beside the globe or across the window, in global, north pole, south pole or near-side views, with a shared cursor and GO TO.
| World | Layers | Missions and instruments |
|---|---|---|
| Mars | 20 | MGS MOLA, TES and MAG/ER; Mars Express OMEGA and HRSC; Odyssey GRS and neutron spectrometer; MRO radio science |
| The Moon | 18 | LRO LOLA and Diviner; GRAIL; Lunar Prospector gamma-ray and neutron spectrometers |
| Mercury | 12 | MESSENGER laser altimeter, X-ray and gamma-ray spectrometers, radio science |
| Ceres | 10 | Dawn radio science, GRaND, VIR and Framing Camera |
| Vesta | 9 | Dawn radio science, GRaND, VIR and Framing Camera |
| Venus | 7 | Magellan radar, radiometer and altimeter; Magellan and Pioneer Venus radio science |
| Pluto | 7 | New Horizons LEISA, LORRI and MVIC |
| Earth | 6 | ETOPO 2022, EGM2008, BedMachine, EMAG2, World Ocean Atlas 2023 |
| Charon | 2 | New Horizons LORRI and MVIC |
05 · Surfaces
From orbit to the ground
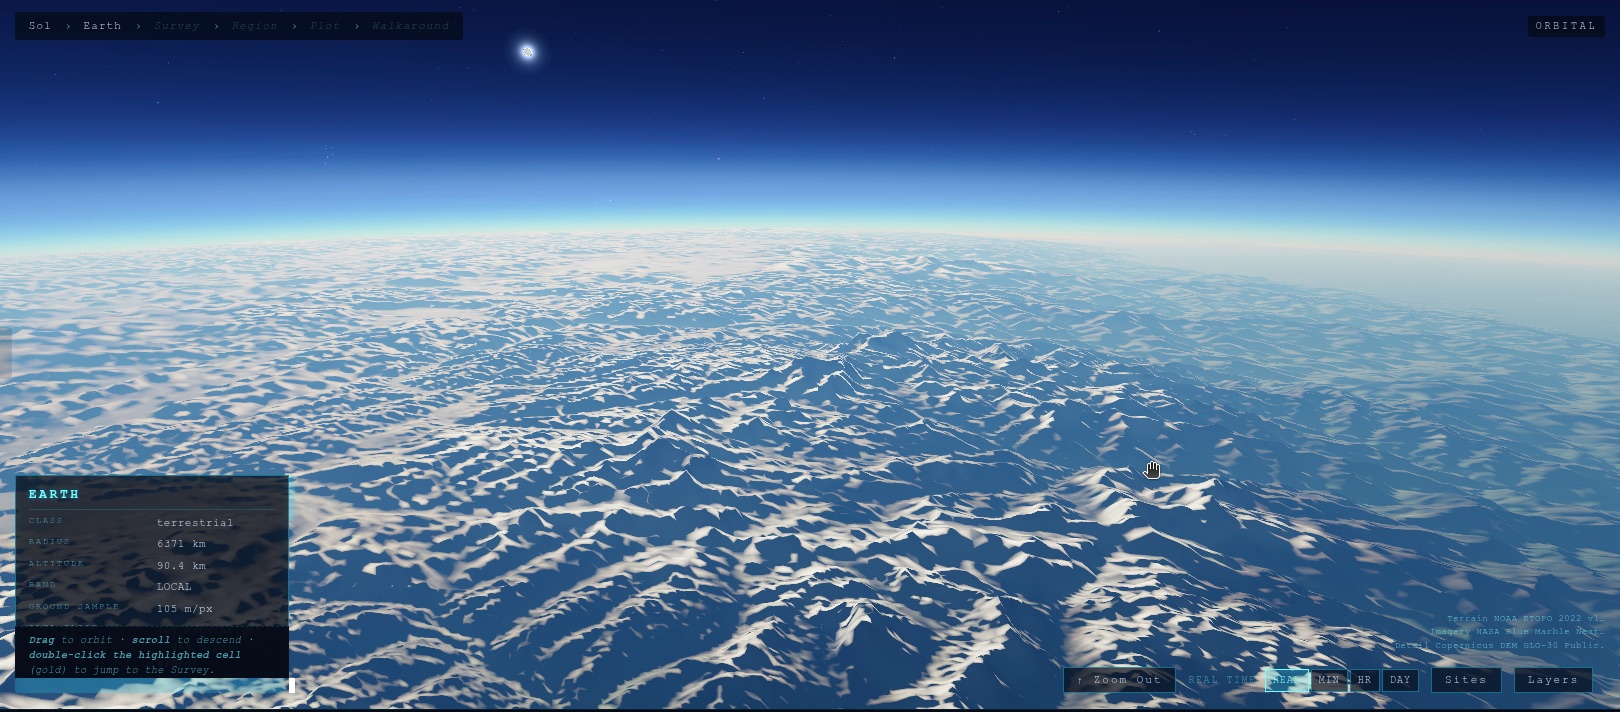
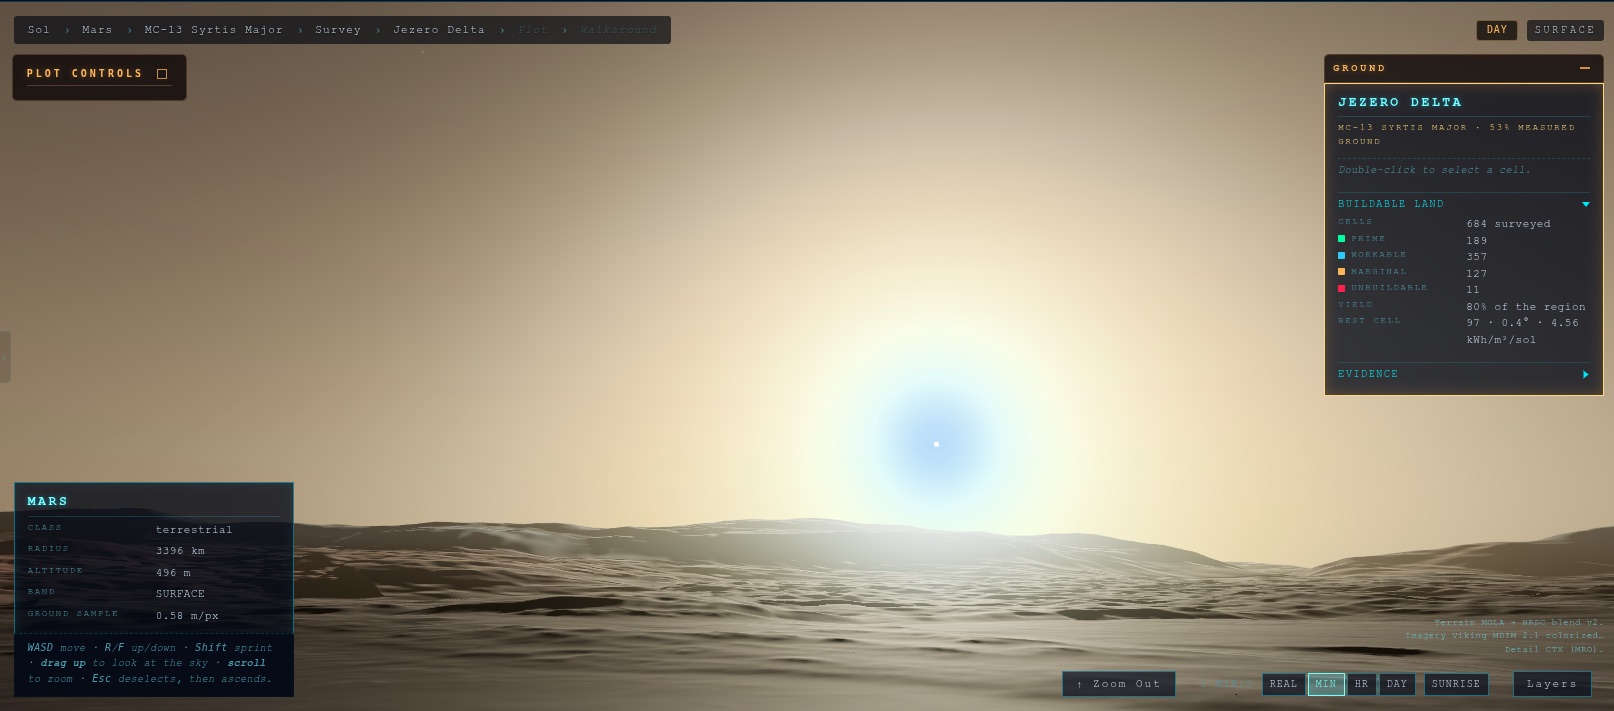
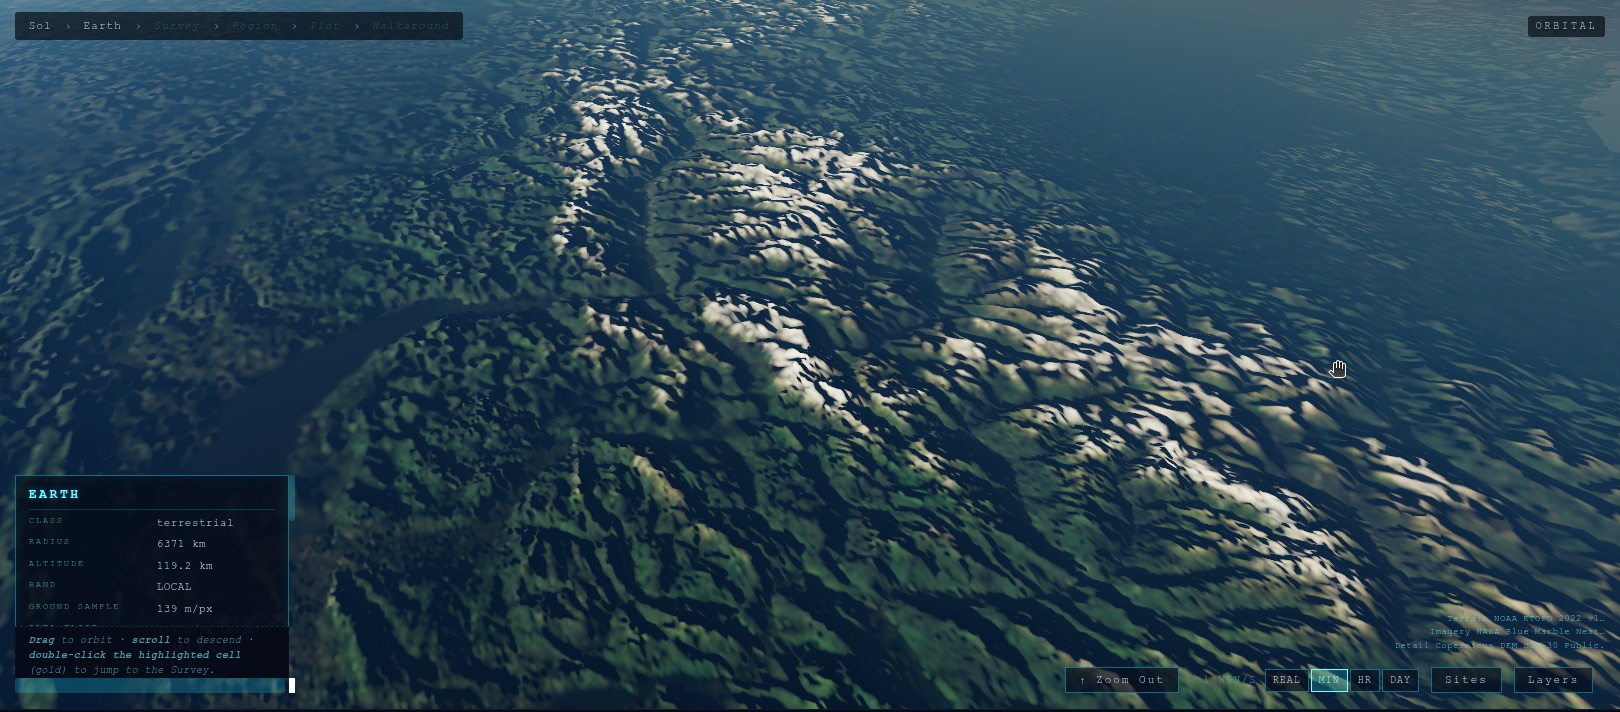
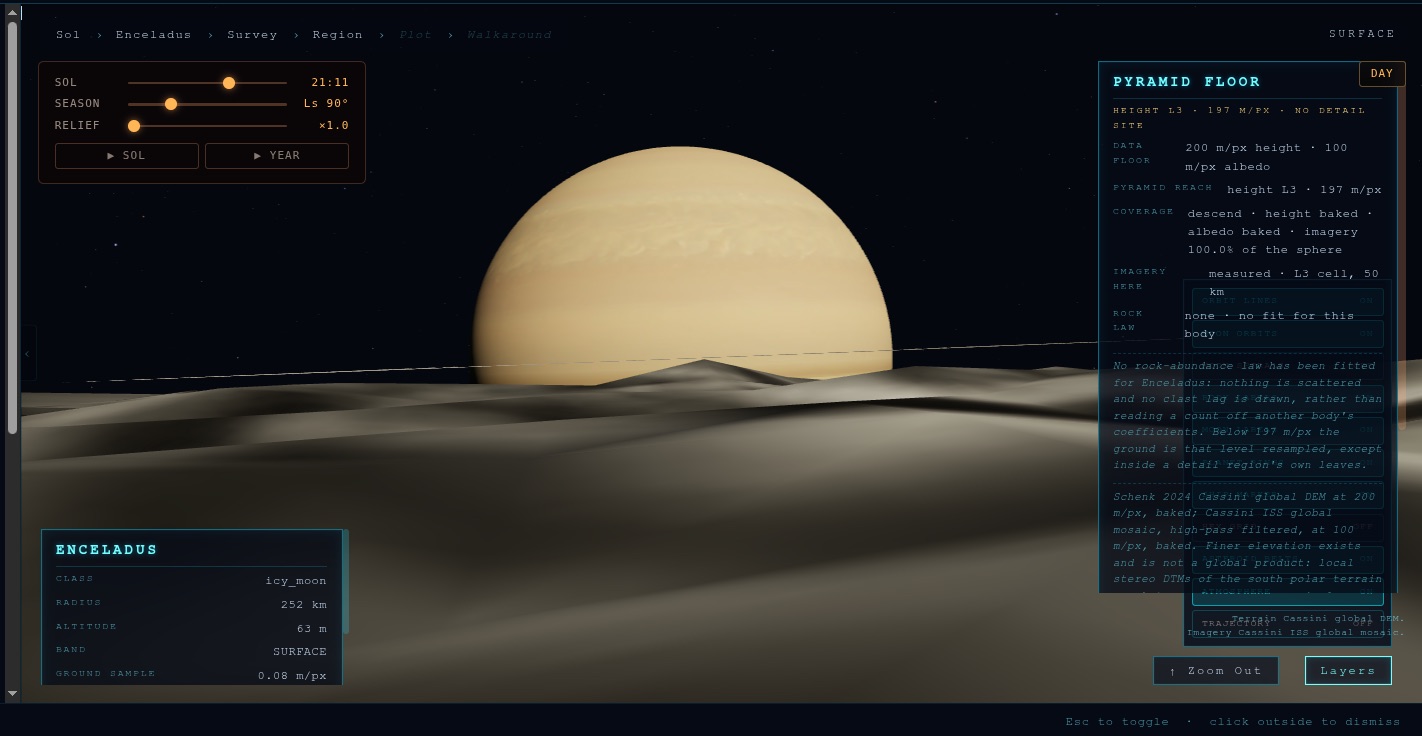
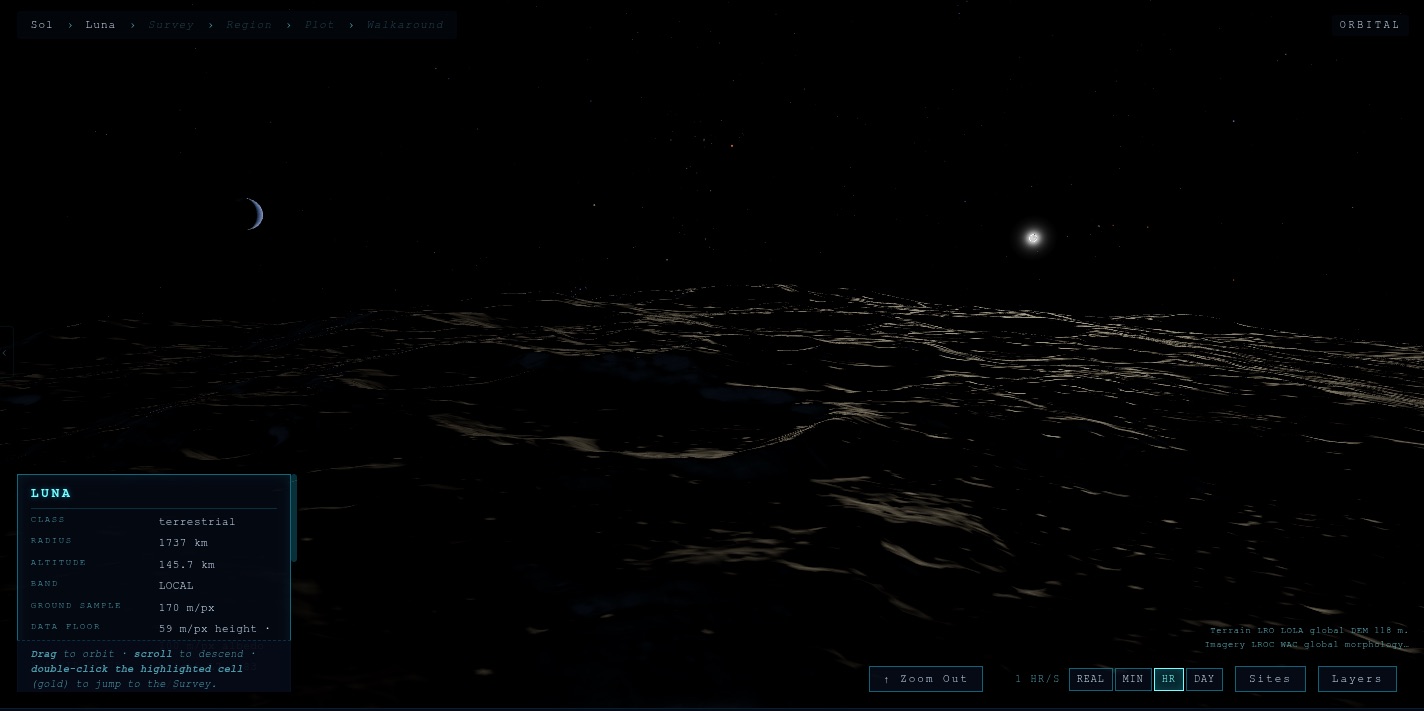
Descend through the atmosphere and walk the terrain at sites humanity has mapped in detail: 134 Moon sites from LROC NAC stereo, 44 HiRISE sites on Mars, both at about 10 m a sample, and the summit regions of the Alps, Everest, Aconcagua and Denali.
06 · Light
Eclipses, sunsets, and real shadows
Light is simulated, not painted. Shadows fall between bodies, eclipses happen when the geometry says they do, and the Sun is white in space and reddened through air.
- Europa eclipse. The small black dot crossing Jupiter's face is Europa's shadow, spotted in the sim and confirmed.
- Body shadows checked against the real November 8, 2022 lunar eclipse.
- No air, no twilight. Lunar night lasts about fifteen Earth days; night vision amplifies exposure about 12x.
Public · no login
The solar system is open.
No account, no install. Pick a body and fly there.